Microsoft Corp.

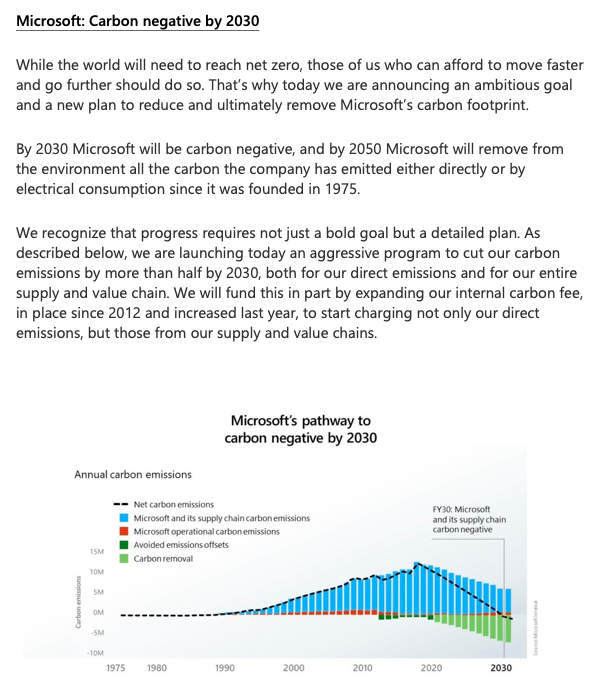
The company plans to reduce its scope 1 and 2 emissions to near zero by the middle of the decade through energy efficiency work and reaching 100 percent renewable energy by 2025. Net Zero Tracker
An interesting fact about Microsoft's environmental policy is that it has been operating carbon neutral since 2012. Net Zero Tracker
In addition, you can check …"
Current Score (vs. LY)
75.6 pts (-10.0)
Last Update: Dec. 18, 2024Greenhouse Gas Emissions
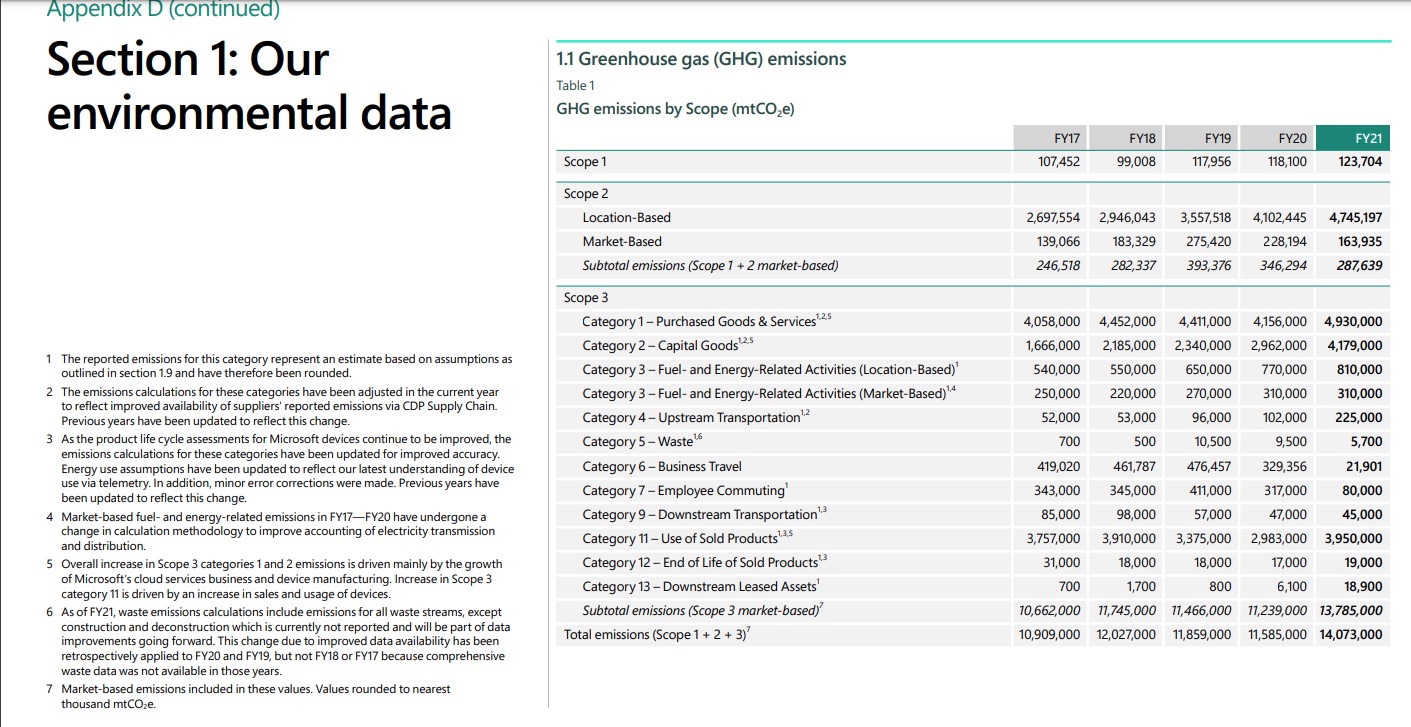
Last 3 Years Emissions Data Summary
| Y2021 | Y2020 | Y2019 | |
|---|---|---|---|
| Scope 1 | 123,704 | 118,100 | 117,956 |
| Scope 2 - location-based | 4,745,197 | 4,102,445 | 3,357,518 |
| Scope 2 - market-based | 163,935 | 228,194 | 275,420 |
| Scope 1-2 - location-based | 4,868,901 | 4,220,545 | 3,475,474 |
| Scope 1-2 - market-based | 287,639 | 346,294 | 393,376 |
| Scope 3 | 13,784,501 | 11,698,956 | 11,357,357 |
| Total - location-based | 18,653,402 | 15,919,501 | 14,832,831 |
| Total - market-based | 13,762,140 | 11,585,250 | 11,750,733 |
Note: Data sources detailed here
Performance vs. Target
Value Chain (scope 3) Emissions by Category
Emissions Trajectory (Full Scopes)
Please refer to the library for viewing the supporting documentation
Sector Benchmark
Note: Latest GHG and revenue data (based on tradingview.com) are used to calculate GHG emissions intensity by sector. The color scale of each bubble depends on the GHG intensity (GHG emissions per 1 million USD revenue). Sectors follow the Global Industry Classification Standard (GICS) that organize companies based on their primary business activities. The 11 sectors are : Information Technology, Health Care, Financials, Consumer Discretionary, Communication Services, Industrials, Consumer Staples, Energy, Utilities, Real Estate, and Materials.
Microsoft Corp. belongs to the sector Information Technology.
Reduction and Net Zero Targets
>Note: intensity targets are not represented in the current version - see Methodology
Gross Absolute Emission Reductions
| Scope | Reduction Objectives | Base Year | Target Year | Comments |
|---|---|---|---|---|
| S1S2S3MKT | 50.0 | 2019 | 2030 | |
| S3 | 50.0 | 2020 | 2030 | |
| S1S2MKT | 75.0 | 2013 | 2030 | |
| S1S2MKT | 75.0 | 2013 | 2045 |
Net Absolute Emission Reductions
| Scope | Reduction Objectives | Base Year | Target Year | Comments |
|---|---|---|---|---|
| S1S2S3MKT | 100.0 | 2019 | 2030 |
Net Zero Future Commitments
| Scope | Scope 3 Coverage | Target Year | Comments |
|---|---|---|---|
| S1S2S3LOC | FULL | 2030 |
Net Zero Policy
The company has a net zero policy : every year, carbon emissions will be balanced with carbon offsets, on OTHER scope emissions.Science-based Targets (SBTI)
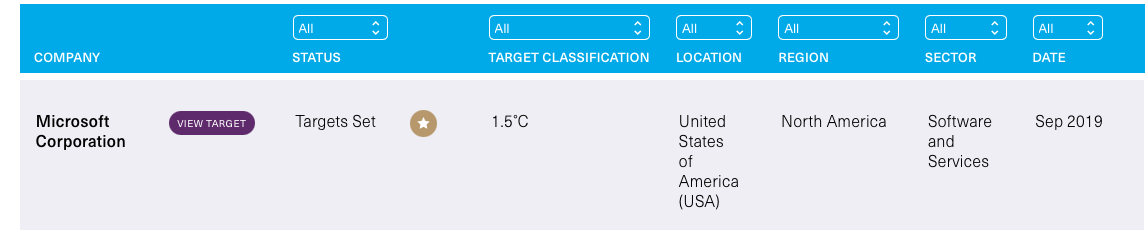
Date Published / Updated :2020-01-01 01:00:00
| Near-term | Long-Term | Net Zero Standard |
|---|---|---|
| Targets set : 1.5°C by 2030 | No target | Commitment removed |
American multinational technology company Microsoft commits to continue annually source 100% renewable electricity through 2030. Microsoft also commits to reduce scope 3 GHG emissions intensity per unit of revenue 30% by 2030 from a 2017 base year and to avoid growth in absolute scope 3 emissions.
Data source: SBTIOffsets
Last update for Microsoft by zerotracker.net: Dec. 1, 2025| Planning to use external offset credits | Yes |
| Separate targets for emission reductions and removals | Yes |
| Conditions on use of offset credits |
|
| Plans for carbon dioxide removal (CDR) | Yes (unspecified) |
Additional notes: In FY24, Microsoft signed long-term agreements to procure more carbon removal than all previous years combined, achieving nearly 22 million metric tons in contracts for carbon removal. We are committed to helping build the markets we buy from, translating leading science into commercial innovation and regularly updating our Criteria for High-Quality Carbon Dioxide Removal. We also know we cannot accelerate this market alone, which is why we co-founded the Symbiosis Coalition with industry partners. The Symbiosis Coalition is targeting up to 20 million metric tons of high-quality, nature-based carbon removal credits by 2030. Pg. 5
Score Summary
| Ref | Principle |
Score
(points) |
Max
(points) |
Delta
(points) |
|---|---|---|---|---|
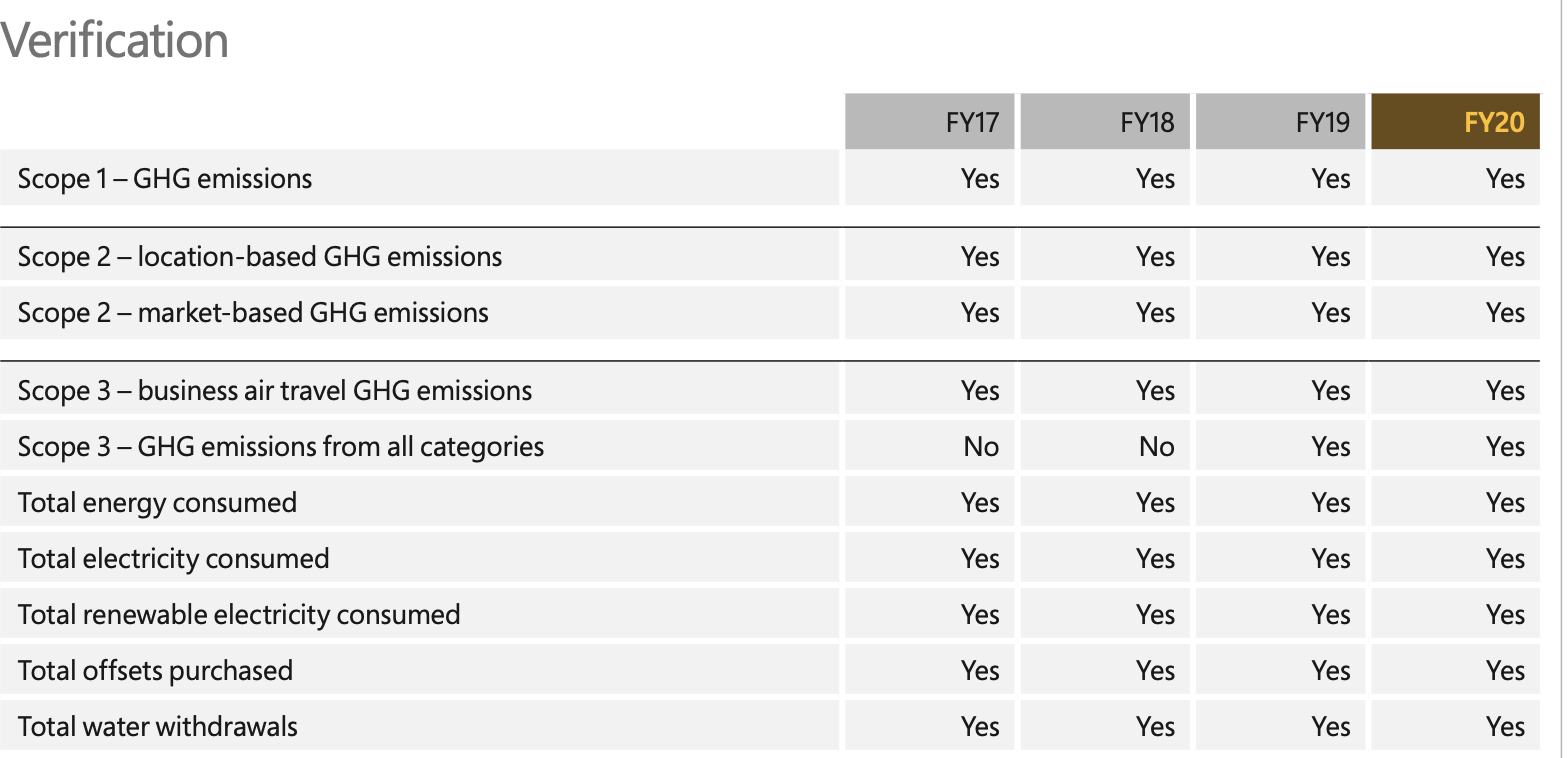
| 1 | At least 2 years of GHG emissions for scope 1 and 2 are publicly-available and externally-verified | 10.0 | 10.0 | 0.0 |
| 2 | Scope 3 emissions are fully reported and externally-verified | 10.0 | 10.0 | 0.0 |
| 3 | CDP score demonstrates the level of transparent disclosures | 0.0 | 10.0 | -10.0 |
| Transparency | 20.0 | 30.0 | -10.0 | |
| 4 | Net Zero Commitments by 2050 include an intermediate target and cover all the emissions | 10.0 | 10.0 | 0.0 |
| 5 | Net Zero targets demonstrate a high-level of emergency | 8.333333333333334 | 10.0 | 0.0 |
| 6 | Emission reduction targets on a forward-looking basis are ambitious | 7.2251367551379015 | 10.0 | 0.0 |
| 7 | Targets are science-based as validated by SBTi | 10.0 | 10.0 | 0.0 |
| Commitments | 35.55847008847124 | 40.0 | 0.0 | |
| 8 | Results re. operational emissions reduction: on-pace (performance-to-date) and momentum (forward-looking targets) | 10.0 | 10.0 | 0.0 |
| 9 | Results re. value chain emissions reduction: on-pace (performance-to-date) and momentum (forward-looking targets) | 0.0 | 10.0 | 0.0 |
| 10 | Implied Temperature Rating by MSCi | 10.0 | 10.0 | 0.0 |
| Results | 20.0 | 30.0 | 0.0 | |
| Total | 75.6 | 100.0 | -10.0 |
Score Details
| Criteria | Results | 2024 Score | 2023 Score | Vs. 2023 | 2022 Score |
|---|---|---|---|---|---|
| Criteria 1 : Transparency on operational emissions (Scope 1 + 2) | |||||
| Are S1+S2 figures publicly-disclosed for the last reporting year and the preceding period? | yes | 5.0 / 5.0 | 5.0 | 0.0 | 5.0 |
| Are S1+S2 figures verified by a 3rd-party for the last reporting year? | yes | 5.0/ 5.0 | 5.0 | 0.0 | 5.0 |
| Criteria 2 : Transparency on value chain emissions (Scope 3) | |||||
| Are the 15 categories fully or partly disclosed? | full | 5.0 / 5.0 | 5.0 | 0.0 | 5.0 |
| Are S3 figures fully or partly verified by a 3rd-party for the last reporting year? | full | 5.0 / 5.0 | 5.0 | 0.0 | 5.0 |
| Criteria 3 : Quality and Frequency of reporting | |||||
| What is the latest CDP score (no later than the preceding year)? | F | 0.0 / 10.0 | 10.0 | -10.0 | 10.0 |
| How many interim reporting were provided between 2 reporting periods (GHG emissions only)? | |||||
| Criteria 4 : Net Zero Commitments | |||||
| Does the net 0 target include a statement of a generally-accepted net zero emission target by 2050? | yes | 3.0 / 3.0 | 3.0 | 0.0 | 3.0 |
| Does the net zero target include an intermediate target by 2030? | 2030 | 3.0 / 3.0 | 3.0 | 0.0 | 3.0 |
| Does the net zero target include all the emissions? | yes | 4.0 / 4.0 | 4.0 | 0.0 | 4.0 |
| Criteria 5 : Target year for Net Zero Commitments | |||||
| Target year for achieving net zero emissions for S1+S2? | Net Zero Policy | 5.0 / 5.0 | 5.0 | 0.0 | 5.0 |
| Target year for achieving net zero emissions for S1+S2+S3 combined? | 2030 | 3.3 / 5.0 | 3.3 | 0.0 | 3.3 |
| Criteria 6 : Reduction objectives | |||||
| What is the forward-looking GHG% reduction (without compensation) for scope 1+2? | 2.2 | 2.2 / 5.0 | 2.2 | 0.0 | 2.2 |
| What is the forward-looking GHG% reduction (without compensation) for scope 1+2+3? | 6.4 | 5.0 / 5.0 | 5.0 | 0.0 | 5.0 |
| Criteria 7 : Science-Based Targets | |||||
| What type of science-based target (as validated by SBTi) did the company commit to? | Targets Set 1.5°C | 10.0 / 10.0 | 10.0 | 0.0 | 10.0 |
| Criteria 8 : Results based on scope 1 - 2 | |||||
| Performance to date: cumulative% reduction vs. target |
Objective (in %):
35.3
Actual (in %): 68.7 |
5.0 / 5.0 | 5.0 | 0.0 | 5.0 |
| Momentum: last year % reduction vs. forward-looking target |
Objective (in %):
2.2
Actual (in %): 16.9 |
5.0 / 5.0 | 5.0 | 0.0 | 5.0 |
| Criteria 9 : Results based on scope 1 - 2 - 3 | |||||
| Performance to date: cumulative% reduction vs. target |
Objective (in %):
9.1
Actual (in %): -17.1 |
0.0 / 5.0 | 0.0 | 0.0 | 0.0 |
| Momentum: last year % reduction vs. forward-looking target |
Objective (in %):
6.4
Actual (in %): -18.8 |
0.0 / 5.0 | 0.0 | 0.0 | 0.0 |
| Criteria 10 : Implied Temperature Rise (ITR) | |||||
| Is the company aligned with global climate targets? | ITR: 1.4°C | 10.0 / 10.0 | 10.0 | 0.0 | 10.0 |
| Total | 75.6 / 100.0 | 85.6 | -10.0 | 85.6 | |
Available Data Sources
| Reporting Year | 2022 | 2021 | 2021 | 2021 | 2020 | 2020 | 2020 | 2020 | 2020 | 2019 | 2019 | 2019 |
|---|---|---|---|---|---|---|---|---|---|---|---|---|
| Source | Wikirate (NV) | NZPDU | Yourstake | Public | Public | Wikirate | CDP | NZPDU | Public | Public | CDP | NZPDU |
| Publication Year | unknown | 2022 | unknown | 2022 | 2022 | unknown | 2021 | 2021 | 2021 | 2021 | 2020 | 2020 |
| Scope 1 | 139,413 | 123,704 | 123,704 | 123,704 | 118,100 | 118,100 | 118,100 | 118,100 | 118,100 | 117,956 | 113,412 | 113,412 |
| Scope 2 - location-based | 6,381,250 | 4,745,197 | 4,745,197 | 4,745,197 | 4,102,445 | 4,330,639 | 4,102,445 | 4,102,445 | 4,102,445 | 3,357,518 | 3,556,553 | 3,556,553 |
| Scope 2 - market-based | NA | 163,935 | 163,935 | 163,935 | 228,194 | NA | 228,194 | 228,194 | 228,194 | 275,420 | 275,375 | 275,375 |
| Scope 1-2 - location-based | 6,520,663 | 4,868,901 | 4,868,901 | 4,868,901 | 4,220,545 | 4,448,739 | 4,220,545 | 4,220,545 | 4,220,545 | 3,475,474 | 3,669,965 | 3,669,965 |
| Scope 1-2 - market-based | NA | 287,639 | 287,639 | 287,639 | 346,294 | NA | 346,294 | 346,294 | 346,294 | 393,376 | 388,787 | 388,787 |
| Scope 3 | 12,571,000 | 13,784,501 | 13,784,501 | 14,284,501 | 11,698,956 | 11,587,756 | 10,817,756 | 10,817,756 | 10,817,756 | 11,357,357 | 11,322,527 | 11,322,527 |
| Total - location-based | 19,091,663 | 18,653,402 | 18,653,402 | 19,153,402 | 15,919,501 | 16,036,495 | 15,038,301 | 15,038,301 | 15,038,301 | 14,832,831 | 14,992,492 | 14,992,492 |
| Total - market-based | NA | 13,762,140 | 14,072,140 | 14,072,140 | 11,585,250 | NA | 10,984,050 | 10,984,050 | 11,164,050 | 11,750,733 | 11,541,314 | 11,541,314 |
Sources
- CDP: Data from CDP Climate Change Questionnaire - see CDP website
- Yourstake: Data from YourStake.org - see Free SFDR data library
- Wikirate: Data from Wikirate.org. Scope 1, Scope 2 and Scope 3 emissions metrics designed by Global Reporting Initiative and contributed by the Wikirate community, adaptation by the Net0Tracker team, licensed under CC BY 4.0. Wikirate-NV means non-verified data sourced in Wikirate. See explanation here
Please refer to the library for viewing the supporting documentation